This article is more than 1 year old
You'll never guess what NetApp's new E-Series flash box ca... Yes. It's faster and stores more
Now with added NVMe-over-fabrics support
Analysis Every two years or so NetApp brings out a new E Series flash box that stores more and goes faster than the last one. This month we have the EF570 arriving, updating the 2015-launched EF560. NetApp claims benchmark-backed price/performance leadership and NVMe-over-fabrics support, and we reckon this deservers a closer look.
The E-Series flash arrays are intended for on-premises high-access rate work such as big data analytics, intensive video surveillance analysis and that sort of thing, leaving general CSP-type work to the SolidFire arrays and fast storage access in the ONTAP environment to NetApp's all-flash FAS arrays.
Compared to the EF560, the new box has significantly faster interfaces, large-capacity SSDs and better performance. There must be a brace of better Xeon CPUs in its two controllers but NetApp hasn't yet revealed any details.
- The EF560 delivered 825,000 sustained IOPS while the EF570 goes up to one million of them
- The EF560's system memory was 24GB while the EF570's ranges from 32 to 128GB.
- The EFG560's average latency was <300µs - <800μs while the EF570 provides <100µs - <300μs, enabling NetApp to claim a sub-100 microsecond response
- Maximum capacity on the 2U/24-bay box goes up from the EF560's 192TB to 367TB
- The EF570 will scale out to 1.8PB
- Supported SSD capacities are 800GB, 1.6TB, 3.2TB, 15.3TB, and 1.6TB FIPS fir full drive encryption. The EF560 sported 400GB, 800GB, and 1.6TB SSDs
- The EF650 supported 8 x 16Gbit/s Fibre Channel. The EF570 moves up to 8 x 32Gbit/s
- For iSCSI the EF570 supports 8 x 10Gbit/s or 8 x 25Gbit/s Ethernet. The EF5650 was limited to 8 x 10Gbit/s
- The EF560's 4 x 56Gbit/s InfiniBand support moves up to 4 x 100Gbit/s and an NVME over IB option is available
The 15.3TB SSDs could be Toshiba CM5s, which are 64-layer 3D NAND drives with dual-port, PCIe Gen 3 x4 NVMe connectivity. But there are Samsung 15l.36TB SAS SSDs also available; the PM1633a range. NetApp hasn't said which type it is using.
The E570 box uses v121.4 of the SANtricity operating system, which adds asynchronous and synchronous remote mirroring plus a Cloud Connector showing NetApp's Data Fabric is embracing the E Series more strongly.
SPC-1 benchmark
As it did with the EF560, NetApp has provided an SPC-1 benchmark (PDF) for the EF570.
The SPC-1* result is 500,022 IOPS with a price/performance of $0.13/IOPS. The IOPS number is a long way below the leading DataCore Parallel Server score of 5,120,098.98 but not far behind that system's $0.10/IOPS price performance.
An all-flash FAS A700 is third in IOPS performance at 2,400,059.26. The EF560 scored 245,011.76, with the EF570 more than doubling that to be 17th in sheer IOPS performance ranking, as the chart shows:
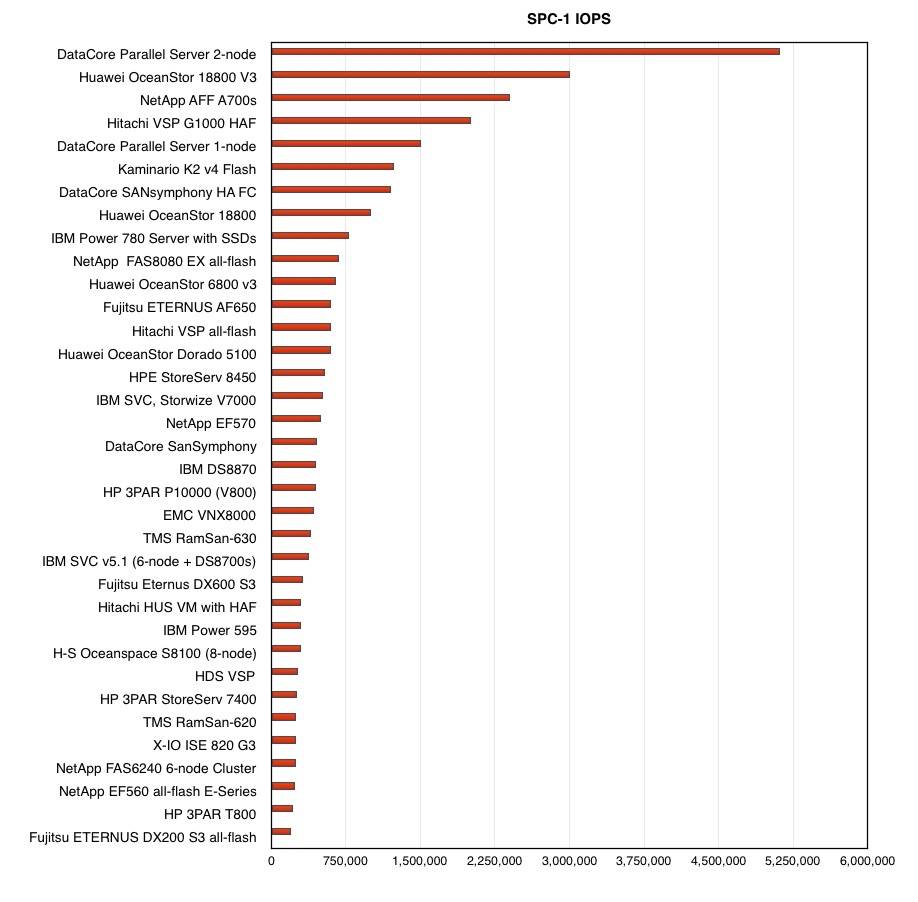
SPC-1 IOPS ranking. Click to enlarge
The EF570 is the fourth best price/performance SPC-1 system tested, with the top three positions being held by DataCore. It is the industry's best price/performance dual-controller array in SPC-1 terms, leaving the EF560 and its 10th placed $0.54 rating behind:
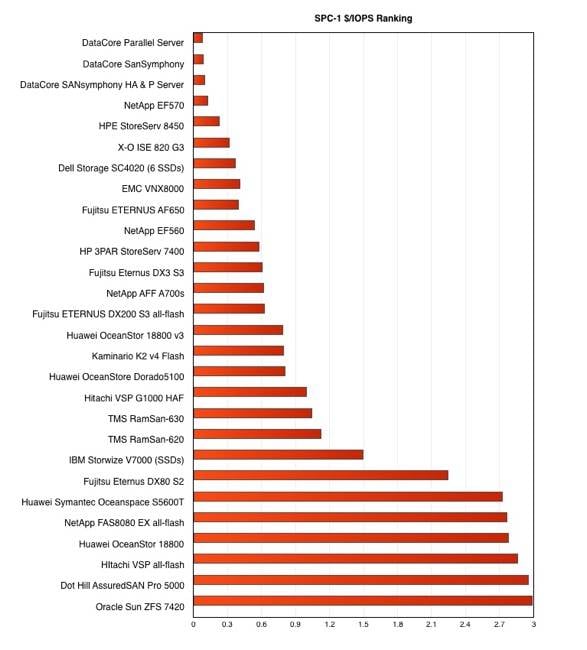
SPC-1 price/performance
SPC-2 benchmark
The SPC-2** benchmark shows that the E570 is in a class of its own. It achieved 17,337.75 MBPS with a price/performance of $3.69; a record. The MBPS rating is the 6th highest but the price/performance is the absolute lowest. Plotting SPC-2 results in a chart shows that the EF570 stands alone in the lower part of the chart;
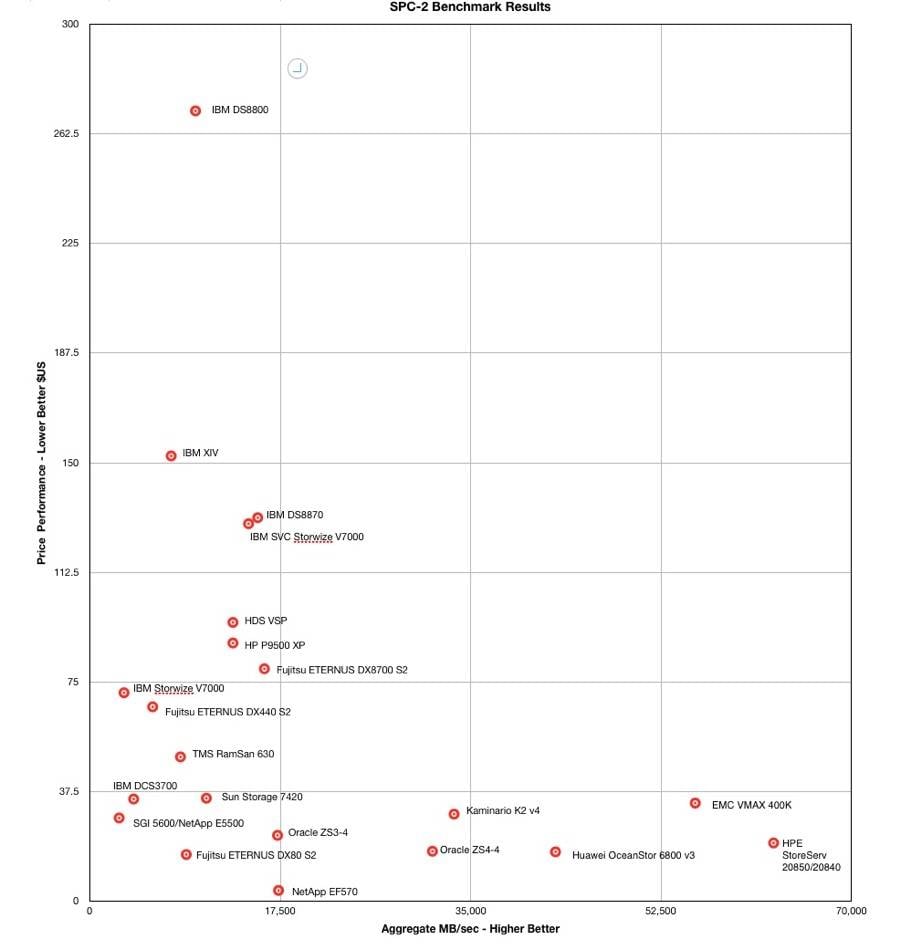
SPC-2 chart of price/performance and bandwidth. Click to enlarge
The EF560 SPC-2 benchmark configuration used multiple 12Gbit/s SAS connections to the host servers and, we understand, SAS-connected SSDs. This means we don't have an NVMe-over-fabrics performance data for the array.
We don't have an EF560 SPC-2 result for comparison, nor any DataCore results, possibly just as well. NetApp says the EF570 "has demonstrated the world's leading price/performance results for both SPC-1 and SPC-2 benchmarks in the same system. With price/performance ratios of $0.13/SPC-1 IOPS and $3.69/SPC-2 MBPS, NetApp has established its standing as the storage industry's price/performance leader for transactional and bandwidth workloads." True dat.®
Bootnote
* The SPC-1 benchmark consists of a single workload designed to demonstrate the performance of a storage subsystem while performing the typical functions of business critical applications characterised by predominately random I/O operations and require both queries as well as update operations.
** The SPC-2 Storage Performance Council benchmark calculates overall storage array performance in throughput (MB/sec) and (discounted) price/performance terms. These two numbers are calculated from three component workloads: large file processing; large database query; and video-on-demand.
