This article is more than 1 year old
Bishop Hill: Gonzo science and the Hockey Stick
Torturing the climate numbers until they confess
Interview In 2001 the IPCC published its Third Assessment report prominently featuring a graph that became "the logo of global warming". Previous historical reconstructions didn't show our modern warm climate as particularly anomalous. This was very different, and was hailed as a "call to action". Yet Michael Mann's studies were deeply flawed. Omit one or two proxies, for example, and the scary warming 'spike' disappears. Mann's model could produce hockey stick shapes using random data, such as baseball scores, or red noise. Critics alleged that Mann's choices of data and statistical tools all cooled the Medieval Warm Period, and emphasised late 20th Century warming.
A new book recounts how the 'Hockey Stick' model was created and more intriguingly, the political and institutional defence of the indefensible. (At one stage the Hockey Stick's defenders argued that trees on different continents had "teleconnections" with each other - a claim that wouldn't be out of place in a homeopathy brochure.)
Andrew Montford, a science publisher and blogger under the name Bishop Hill, has provided the storytelling to match the detective work and persistence of another blogger, Steve McIntyre, who dismantled the Stick. Andrew talked to us about The Hockey Stick Illusion and some of the key issues it highlights.
You say the IPCC needed the Hockey Stick to be true, and that's why it got such prominence. Was this the best they could do?
If you put any of the other major temperature reconstructions in place of the Hockey Stick I think it's true to say it doesn't look so frightening. They have a Medieval Warm Period that is within a whisker of the temperatures we have now. You can make them look scarier by overlaying the instrumental record over the 20th Century part of the graph - in fact, that's part of the reason why it looks scary. I show this in the book - in Briffa series [see below].
But [these reconstructions] wouldn't convince anybody there's anything going on there at all. So yes, they needed it to convince people; and they promoted it, they had policies to sell. And when it proved to be flawed they had to stand behind it, because otherwise, they'd look stupid.
Now to the story. The preparation of the original Hockey Stick turns out to be a small part of the saga. How the issues McIntyre raised were dealt with by the scientists and the establishment is the main story.
Yes, the book is a detective story of how Steve McIntyre worked out how the Hockey Stick got its remarkable shape, which was a combination of data that's not suitable and questionable statistical methodology. I didn't want to dwell on what happened upfront, it's about how the Hockey Stick met its demise, if you like.
So for the data: people might have heard of Mann's use of bristlecones, which are poor proxies for temperature.
Right, the theory is if you have the right trees you can use them as a thermometer - they'll grow more in a warm year than they will in a cool year. But not every tree. The theory is that trees at the northern limit or upper treeline on the sides of mountains will be sensitive to temperature. But they could be affected by water and nutrients. And there is some doubt as to whether there really is a temperature signal in the tree rings. It's certainly very noisy, if it's there at all.
And this is one of the things that comes out in the book. I spend quite a lot of time discussing the verification statistics: if the mathematical model derived from the tree rings actually is credible in statistical terms. Whether it looks as though the model can create temperatures of the past.
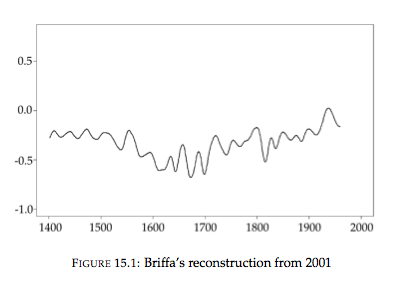
Keith Briffa's reconstruction showed no hockey stick
And this is something Mann went to great lengths, with the Hockey Stick, to keep from us?
Essentially statisticians have a range of measures of testing whether the numbers that fall out of their mathematical models match up to the real world. In the case of the Hockey Stick they used something called a verification period, where they reconstruct the temperatures for the second half of the 19th Century, based on the model, and compare that to the real temperatures, based on thermometers. That can be calculated using a range of measures, but the two that are important for the history of the Hockey Stick are R2 and the RE.
The R2 statistic is essentially a very standard statistical measure of how lines match up against each other, while the RE is a very obscure measure that is only used by climatologists, and has been very heavily criticised because its behaviour in different circumstances isn't really understood. It hasn't been studied by statisticians.
In the story of the Hockey Stick I spend quite a lot of time discussing a paper by two associates of Mann called Wahl and Amman, claiming they had replicated the Hockey Stick entirely. McIntyre did a lot of work looking at their study, and one of the things he concluded was that their model failed the R2 test. This meant it was not credible. So if Wahl and Amman's model was not credible, Mann's was not either.
McIntyre put a lot of pressure on the journal that published it to publish the data and methodology, and they eventually agreed. And it said the Hockey Stick passed that RE test.
There's another really amazing story of how McIntyre found it didn't pass the RE test at all, but there had been a rather dubious, ad hoc adjustment made to the procedure to make it look as if it passed the RE test. It really is the most extraordinary part of the story I think.
What did they do?
This is where it gets quite technical. With the RE statistic, the question is how high does it have to be before you decide your results are 'significant'. So you calculate a benchmark, which involves throwing random numbers into your model, instead of real data, to see how well that compares against the real temperatures.
What Wahl and Amman did in essence was not to take a random set of numbers, but a set of numbers that had been filtered in such a way that the benchmark for the RE became considerably lower, making the Hockey Stick look significant. This was a procedure that was new, no one had ever seen it before, and it defeated the basic object of the analysis, which was to compare what you got with what you could get with random numbers.
So the methodology remains secret, but Mann has gone on to apply the Hockey Stick to different situations. One of which is a Hockey Stick that didn't have tree proxies in it.
Mann has subsequently published new temperature reconstructions that all have Hockey Stick shapes, and these have been picked up by the media, and trumpeted as proof that the Hockey Stick despite its many flaws, was still OK.
There are many problems with these subsequent Hockey Sticks. The paper Mann did in 2008 is particularly famous because it was discovered that in one of the proxies he was using, which was a lake sediment series [varve] from Scandinavia, the uptick or blade of the Hockey Stick was due to agriculture disturbance of the sediment rather than anything climatic. But not only that, he'd got the segment upside-down anyway.
